| Measure | Value | Planning use |
|---|---|---|
| Average charging energy, tested e-bikes | 1.36 kWh per 100 miles (0.84 kWh per 100 km) | Use as the baseline when you have no data on your own bike. |
| Spread between bikes | 0.8 to 3.3 kWh per 100 miles | The bike you ride matters more than the average, so check your own bike before budgeting. |
| Cost at the US average residential rate | $0.25 per 100 miles at $0.186/kWh (range $0.15 to $0.62) | Charging cost is small for most riders, so tariff differences rarely decide whether to ride. |
| Cheapest and dearest state | $0.16 per 100 miles at $0.120/kWh (North Dakota); $0.57 at $0.422/kWh (Hawaii) | Swap in your own tariff to see where you fall between these ends. |
| Electric car, same distance | 24 to 72 kWh per 100 miles; $4.45 per 100 miles at the US average rate | Replacing car miles with e-bike miles cuts energy use sharply. |
These figures come from the e-bike monitoring study results, which report measured charging energy and cost at current average US residential rates.
How much electricity does an ebike use? In a 30-bike monitoring study, the average was 1.36 kWh per 100 miles, costing $0.25 per 100 miles at $0.186/kWh. Your bike, riding style and tariff move that figure.
This guide stays on energy and money. The hub on green transport takes up the question are electric bikes environmentally friendly in full.
What this means for your annual charging cost
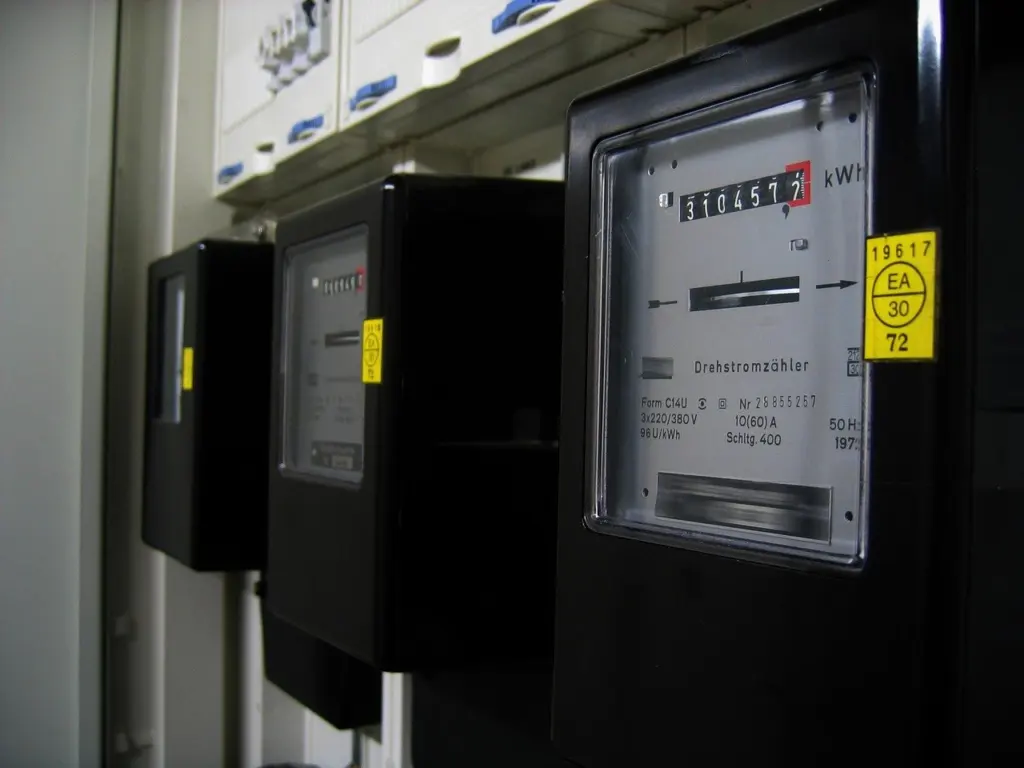
Annual charging cost is small, and the main decision is simply which of your numbers to use. The study gives a cost per 100 miles, so scale it by dividing your yearly mileage by 100 and multiplying by the cost per 100 miles at your own tariff.
The same study logged 30 bikes over 3,457 miles (5,564 km) and 123 charging cycles. At the US average residential rate of $0.186/kWh, that works out at $0.25 per 100 miles on average. The most efficient bike cost $0.15 per 100 miles and the least efficient $0.62.
Choose the figure that fits your situation
- Use the average if you have no measurements. The study average of 1.36 kWh per 100 miles is a sensible planning figure for a typical pedal-assist bike.
- Use the high end if you ride throttle-only or carry loads. The upper end of the tested range, 3.3 kWh per 100 miles, applies to bikes ridden with little pedalling.
- Use your local tariff, not a national one. The study found $0.16 per 100 miles at $0.120/kWh in North Dakota and $0.57 at $0.422/kWh in Hawaii. California came to $0.45 per 100 miles at $0.335/kWh.
Tariff differences change the bill, but even the dearest state in the study stays well under a dollar per 100 miles. A cheaper tariff is a bonus and a dearer one is rarely a reason to leave the bike at home.
Where your bike sits in the range
The type of bike and how you ride it explain much of the spread between 0.8 and 3.3 kWh per 100 miles. The study split its results by bike type, which helps you pick a closer benchmark than the overall average.
- Pedal-assist commuter bikes. These used 0.8 to 3.0 kWh per 100 miles, averaging 1.1, across 17 bikes and 2000 miles of testing. If you pedal with pedal assist on, this is your closest benchmark.
- Pedal-assist cargo bikes. These used 1.0 to 2.7 kWh per 100 miles, averaging 1.7, across 7 bikes and 472 miles. Expect a higher figure if you haul loads regularly.
- Throttle-only commuter bikes. Two bikes ridden with little to no pedal assist used 3.3 kWh per 100 miles over 137 miles. That sample is small, so treat it as a warning rather than a rule. It does suggest that riding on the throttle alone is the costliest way to use the motor.
An e-bike manufacturer’s guide gives a similar planning range of 5 to 15 watt-hours (Wh) per kilometre, from its guidance on how much power an e-bike consumes. Use it as a cross-check if your bike is listed in Wh per km rather than kWh per 100 miles.
Conditions and habits that change consumption
Hills, load, cold and charging routine all shift energy use. The study’s 0.8 to 3.3 kWh per 100 miles spread shows how much the bike and riding style matter, and the manufacturer guidance names the main conditions.
- Hills. Riding uphill significantly increases power consumption, while downhill riding can reduce it. If your commute is hilly, budget towards the upper part of your bike type’s range.
- Load. The more weight an e-bike carries, the more energy it needs. This fits the higher cargo-bike average in the study.
- Assist level. Using pedal assist rather than the throttle alone kept the study’s consumption lower, so pedalling is the simplest lever you control.
- Charging routine. The study found that topping off frequently is less efficient and may lead to faster loss of capacity. Riders in the test charged on average every 28 miles. If you can wait until the battery is lower before plugging in, you avoid a habit the study flags.
A pack that loses capacity sooner has to be replaced sooner, and the guide on how to recycle ebike battery covers what happens at the end of its life. If you want to cut your grid use, see how to charge ebike with solar panel setups.
How the cost formula works
Charging cost is your battery’s energy in kilowatt-hours multiplied by your electricity rate per kWh. The inputs are on the battery label and your bill, and the formula comes from a guide to the cost of charging an electric bike: cost equals battery capacity (kWh) multiplied by the electricity rate ($/kWh).
Watt-hours to kilowatt-hours
A watt-hour (Wh) is the unit batteries are rated in, while a kilowatt-hour (kWh) is the unit your bill uses. Divide Wh by 1,000 to get kWh. Battery capacity in Wh is volts multiplied by amp-hours, so a 48 V and 17.5 Ah pack holds 840 Wh, or 0.84 kWh.
A full charge of that pack costs 0.84 kWh multiplied by your rate per kWh. Capacity figures vary widely: one manufacturer lists a 208.8 Wh battery for a range of up to 80 km, and another lists a 960 Wh removable battery.
Your electricity tariff
An electricity tariff is the price per kWh on your bill. If your tariff has different day and night rates, use the rate you actually charge at. Multiply your battery’s kWh by that rate for one full charge, then scale by how often you charge.
Remember that battery capacity is not the same as energy per mile. The study notes that its figures do not necessarily reflect the available range, and the farthest single-charge distance it recorded was 69 miles. Use the battery for cost per full charge and the study for cost per distance.
How e-bike energy use compares with an electric car
An e-bike uses a small fraction of the electricity of a car over the same distance. The study’s comparison car, a best-in-class high-efficiency electric car, uses 24.0 kWh per 100 miles, against 1.36 kWh per 100 miles for the average tested e-bike.
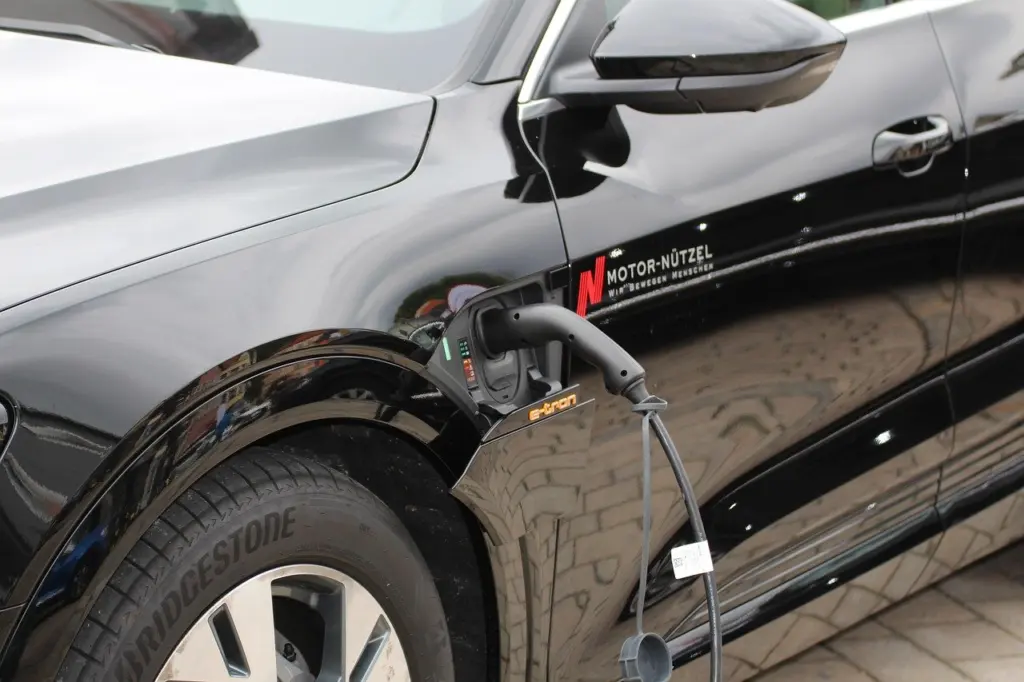
Across 2025 and 2026 US models the study lists electric cars from 24 kWh per 100 miles (Lucid Air) to 72 (Hummer). Charging a car at the US average residential rate costs $4.45 per 100 miles, compared with $0.25 for the average e-bike.
This matters when you decide how to travel for short trips. Swapping car miles for e-bike miles saves energy and money, and the gap is wide even against the most efficient car. Even the least efficient e-bike in the study, at 3.3 kWh per 100 miles, is far below the best car.
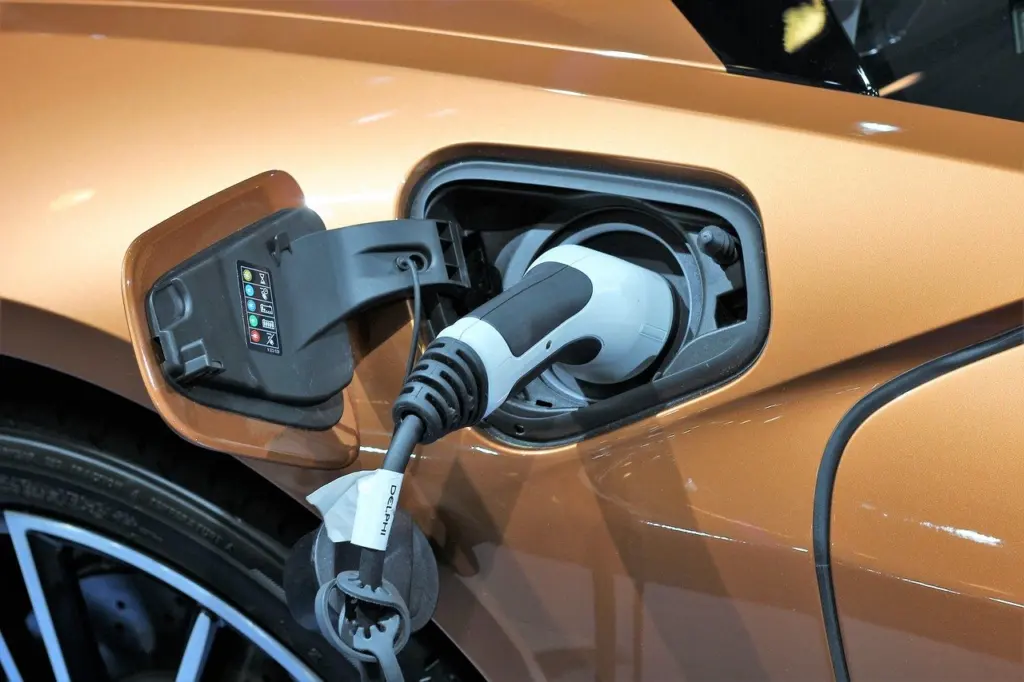
If you are thinking about the car alternative, set the bill against your actual trips. The cost sum above lets you compare the two with your own tariff and mileage.
Frequently asked questions
Does a bigger battery cost more to run?
A bigger battery costs more per full charge because it holds more kWh. It also stores more distance: one manufacturer quotes a 208.8 Wh pack for up to 80 km. Cost per mile depends on the bike’s efficiency, not the pack alone.
Is the study’s energy figure the same as my bike’s range?
No. The study states that its numbers do not necessarily reflect the available range. It measured charging energy per distance ridden, and the farthest single charge it recorded was 69 miles.
Does cold weather change what I pay to charge?
Cold temperatures can reduce battery performance, according to the manufacturer guidance. The guidance gives no figure, so allow for a higher energy use per mile in winter rather than a set amount.
Why use measured test data rather than rider estimates?
Portland State University’s e-bike research page notes that current practice for tracking e-bike data relies on memory recall and self-reporting. Measured charging energy, as in the monitoring study, is a firmer base for a cost estimate.