Are electric bikes environmentally friendly? Mostly yes, when they replace car trips: a published commute comparison puts an e-bike far below a car. The first decision is which trip the bike would replace, because that sets the saving.
The sections below start with that decision. They then work through life-cycle figures, the lithium-ion battery, commuting limits and the alternatives. A shorter companion answer to are electric bikes eco friendly covers the same question in brief.
Start with the trip the bike would replace
An e-bike is green transport mainly because of what it displaces. A rider who stops driving a regular journey removes the largest emissions source in the commute. A rider who adds an e-bike ride to a life that already includes walking, conventional cycling or rail removes much less, and an extra leisure ride on top of existing travel removes nothing.
Use these situations to place yourself.
- You drive a regular commute or school run. This is the strongest case. The comparison table in the next section puts a car commute at the top of the range and an e-bike near the bottom. Moving this trip to an e-bike is where the published figures show the biggest gain.
- You currently take rail or bus. The case is more modest. Rail already sits well below a car in the same table, so the decision turns on time, reliability and comfort as much as on carbon.
- You currently walk or ride a standard bicycle. An electric motor adds battery manufacturing to a trip that was already at the bottom of the range. Switch for accessibility, hills or distance, not for emissions.
- You would ride in addition to your current travel. Leisure riding has real value for health and enjoyment. It is not a carbon saving unless it displaces a car journey that would otherwise have happened.
- You carry children or shopping. This is the car-replacement case that cargo bikes are built for, covered in its own section below.
If your honest answer is the first or last item, keep reading for the figures. If it is the third or fourth, the rest of the article is still useful, but treat the environmental argument as secondary to your reasons for riding.
Life-cycle emissions by commute mode
A life cycle assessment counts emissions across a vehicle’s whole life, including manufacture and use, not only what comes out of an exhaust. That matters for e-bikes. They have no tailpipe, so their footprint is set mainly by how they are built and powered. Gazelle’s blog on whether e-bikes are really eco-friendly says a large part of the greenhouse gases in an e-bike’s life is produced during production.
Annual commute emissions compared
| Commute mode | CO2 per year (commute profile below) | Planning use |
|---|---|---|
| Car | 472 kg | The reference point to beat. Any shift of a regular commute away from the car moves toward the lower rows. |
| Rail | 211 kg | A real improvement on driving. Compare it with an e-bike on convenience and journey time, not on carbon alone. |
| E-bike | 13 kg | The figure is attributed to battery production, so it reflects the cost of making the bike, not riding it. |
| Bicycle | 0 kg | The lowest row. It suggests a simplified comparison rather than a full accounting of every component. |
Gazelle’s blog presents these figures with data attributed to the German Federal Environment Agency, VCD and Pendos, based on a 9.6 km city commute over 252 working days a year.
Reading the table sensibly
The ranking is clear and the gap between car and e-bike is large. Treat the individual values as indicative rather than exact, for three reasons. The comparison comes from a bike brand’s blog, even though it cites German public and mobility-organisation data. It assumes a short urban commute. And a conventional bicycle at zero shows that some inputs are simplified.
The profile also matters for your own case. A longer commute, a different grid, or a bike used on fewer days will move the numbers. The ordering is the part to rely on: a car commute is the highest, and an e-bike commute is a small fraction of it.
What about CO2 per kilometre?
Per-kilometre figures are the usual way to compare modes, but the commute comparison above is expressed per year for a fixed daily distance. That is useful for a decision, because it shows what changing one regular journey does over a working year. For a rate expressed per distance travelled, see the detailed breakdown of electric bike carbon footprint per mile.
The battery: manufacturing and end of life
The lithium-ion battery is the main reason an e-bike is not a zero-impact vehicle. Gazelle attributes the e-bike’s commute figure to battery production, and states that production accounts for a large part of an e-bike’s greenhouse gases. The emissions are front-loaded: they are incurred before the first ride.
This leads to a practical judgement. The environmental value of the battery depends on how long it is used and how much driving it displaces. A battery that powers regular car-replacing commutes for many years justifies its manufacturing footprint better than one that is replaced early or sits unused. Choose a bike from a maker that supports replacement cells and servicing, and look after the pack. The full breakdown is in the guide to ebike battery environmental impact, and durability is covered in how long do electric bikes last.
What happens to e-bike batteries at end of life
A worn-out lithium-ion pack should go to a dedicated battery collection or recycling route, not into household rubbish. Start with the bike’s manufacturer or retailer and your local battery collection scheme, because arrangements differ by place. The step-by-step version is in how to recycle ebike battery.
End-of-life treatment is the least settled part of the e-bike footprint. Published comparisons such as the commute table above concentrate on production and use, so an honest overall verdict leaves room for variation in how packs are handled. A well-used, well-maintained, properly recycled battery sits at the favourable end.
Can an electric bike replace a car for commuting?
For many commutes, yes, and the evidence suggests the benefit varies by where you live. Philips, Anable and Chatterton (2022), writing in Transport Policy, estimate per-person CO2 saving capability from substituting car travel with e-bikes in England. They find it is highest, over 750 kg CO2 per person per annum, for residents of rural areas and the rural urban fringe. They find e-bikes offer major conurbations more modest saving capability per person.
This reverses a common assumption. Dense cities are the natural home of cycling, but the study points to rural residents and the rural-urban fringe as having the most car travel available to replace. The decision follows from that.
- Rural or edge-of-town riders with a regular car journey: the largest personal saving is on offer, and an e-bike’s assistance is what makes a longer trip realistic.
- City dwellers with short journeys: the saving per person is more modest, mainly because transit and walking are already available alternatives. An e-bike still helps where it replaces a car trip, or where hills and distance rule out a standard bicycle.
- Anyone with a very long commute: test the route first. Realistic range depends on the battery, terrain and load, and the guide to ebike commute distance explains how to judge it.
If your route is similar, the car-to-e-bike difference in that table is a fair guide to what is at stake. A longer or hillier route does not rule out an e-bike, but it does make a trial ride and a range check worthwhile before you give up the car for commuting.

Whether people actually swap trips is a separate question from whether they could. The evidence on real behaviour is examined in do electric bikes replace car trips.
Practical conditions that decide it
Emissions arithmetic does not settle whether a commute works. A few everyday questions do:
- Check the route for safe, continuous riding space, since a frightening junction ends more commutes than a hill does.
- Confirm secure parking at both ends, because a bike with a lithium-ion battery is a theft target.
- Plan for weather and arrival, including a spare layer and somewhere to change if you will be sweaty or wet.
- Decide whether you need a fallback, such as rail, for days when the bike cannot do the job.
A household that can answer these four points usually finds the e-bike works for the daily commute and keeps the car for the occasional trip it genuinely cannot replace.

Errands, cargo and family trips
The car-replacement argument is strongest when the bike takes over trips that would otherwise be short car journeys with a purpose: shopping, nursery or school drop-offs, small deliveries. These are the trips where a car feels necessary because of the load, not the distance.
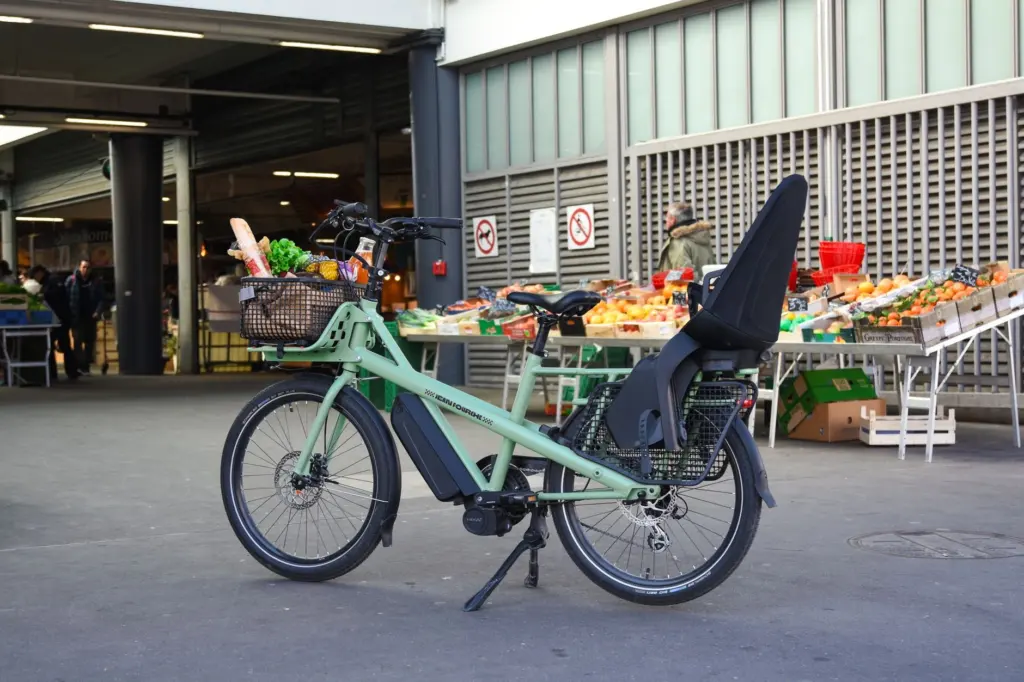
A cargo-style e-bike with a front basket, rear rack or child seat is designed for exactly that. A basket carrying produce and bread, or a seat for a child, covers a good share of the loads that make people reach for the car keys. Check the following before buying:
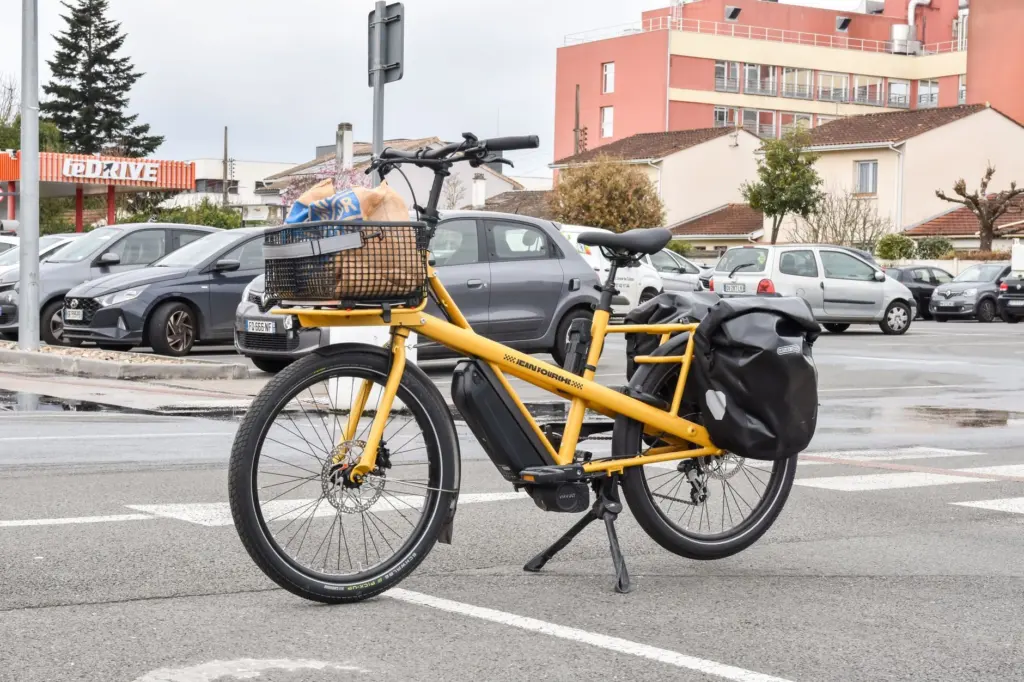
- Load type: groceries need baskets or panniers, while children need a certified seat and a stable, low-slung frame.
- Storage: a longer bike needs a ground-floor or shed space, since carrying it upstairs is rarely practical.
- Frequency: the carbon benefit comes from repeated trips, so choose a bike for the errands you do weekly, not the ones you do once a year.
Charging and the energy behind the ride
Running an e-bike uses electricity, and the footprint of that electricity depends on how it is generated. Gazelle’s commute figure is attributed to battery production rather than charging, which is consistent with the idea that charging is a small part of the total. Even so, the cleaner the supply, the better the e-bike looks.
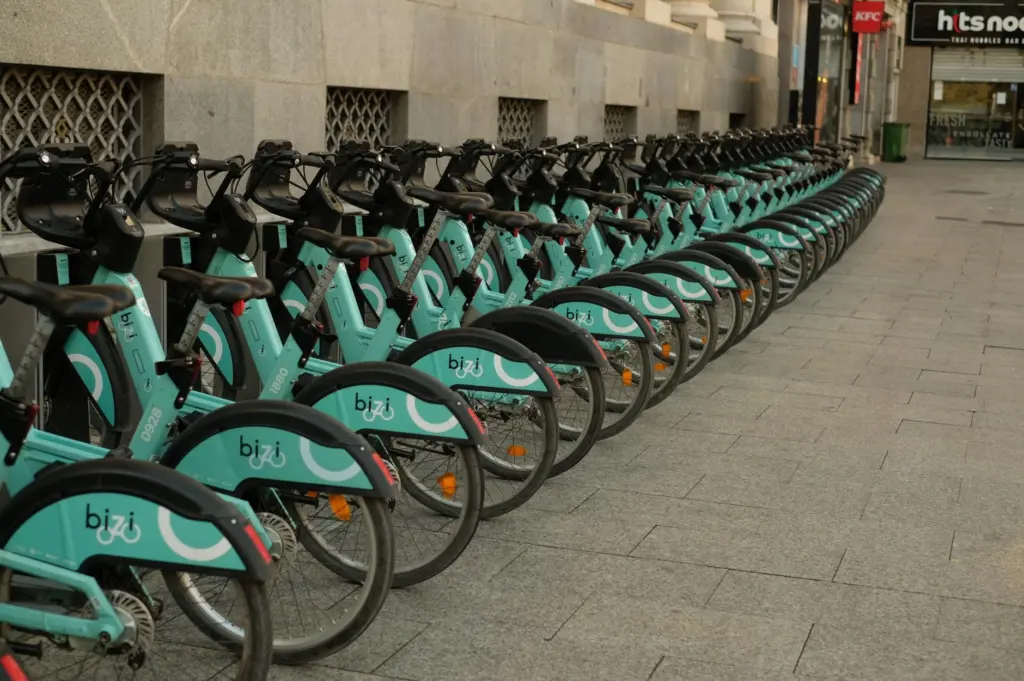
Charging is also the practical side of green riding. Home charging from a wall socket suits most commuters, because the battery can be topped up overnight or at work. Public docking and parking points matter more for shared bikes and for riders without secure storage at home. Look for covered, well-lit parking, since a bike left charging unattended is both a safety and a theft concern.
To understand how much power a typical bike draws, and what it costs you, see how much electricity does an ebike use. Households with rooftop generation can go further and match charging to daytime output, which is the subject of charge ebike with solar panel.
Choosing between car, public transport and bicycle
Compare modes by the trip you actually make. The commute table gives a clear ranking: car highest, rail in the middle, e-bike low, standard bicycle lowest. Practical fit then decides which of the lower options works for you.
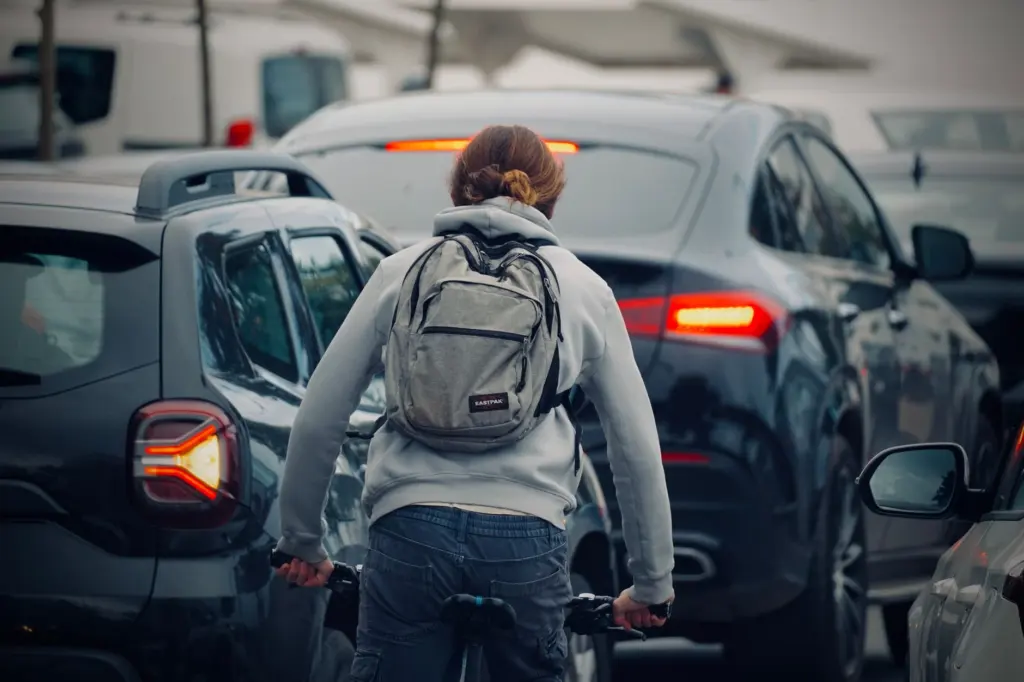
- Choose an e-bike over a car when your regular trip is within comfortable riding distance and you can park securely. This is the biggest gain in the published figures. The wider case is set out in electric bike vs car emissions.
- Choose an e-bike over rail when the door-to-door journey is quicker or more flexible by bike. Rail is cleaner than driving, and the gap to an e-bike is smaller. The comparison is developed in ebike vs public transport carbon footprint.
- Keep the standard bicycle when the route is flat, short and you are fit and happy to arrive warm. It sits lowest in the published figures and has no battery to manufacture or retire.
- Keep the car for specific jobs that no bike can do, such as heavy loads, long distances or mobility needs. A household can cut driving without giving up the car entirely.
How far the savings scale, and where the data is uncertain
Individual savings are clear. National totals are harder. Philips, Anable and Chatterton (2022) estimate an upper limit on CO2 savings from substituting car travel with e-bikes in England of 24.4 MTCO2 per annum. That is a ceiling on capability, not a forecast of what will happen. It describes what would be possible if car trips were substituted as far as the analysis allows.
The authors also note that other changes in technology and reduction in demand would be necessary to reach zero emissions. E-bikes are one component of decarbonised transport, alongside cleaner vehicles, better public transport and less demand for travel. They do not remove the need for those other changes.
The uncertainty is worth keeping in view when reading any single headline figure.
- Assumptions drive results. The commute table depends on a fixed commute profile, and a different distance or number of days changes the totals.
- Capability is not behaviour. Savings only materialise if people actually leave the car at home.
- Location matters. The England study shows rural and rural-fringe residents have more to gain than people in major conurbations.
- Battery end of life is the softest area. Manufacturing is well recognised as a major share of the footprint, while disposal and recycling outcomes vary with local systems.
The 2019 PeopleForBikes report by McQueen, MacArthur and Cherry, The E-Bike Potential: Estimating the Effect of E-Bikes on Person Miles Travelled and Greenhouse Gas Emissions, takes up the same question at scale. It is useful reading for anyone who wants to see how researchers model the effect of e-bikes on travel and emissions. Wider uptake is tracked in electric bike sales statistics.
Infrastructure, health and where e-bikes fit
Whether a household can rely on an e-bike depends partly on the streets around it. Protected lanes, safe junctions and secure parking decide how many people are willing to swap a car trip for a ride. Where the infrastructure is poor, the emissions benefit stays on paper because people do not make the switch.
Before buying, check what riding is permitted on your local paths and roads. Rules differ between places and for different types of bike, and where can you ride an electric bike sets out the questions to ask.
An e-bike can also deliver benefits beyond carbon, notably activity built into a daily journey. The guide to health benefits of electric bikes covers that side of the argument. For background on how the technology reached today’s form, see who invented the electric bike.
A short checklist for a greener e-bike decision
- Identify the regular car trip you intend to replace and confirm the route is rideable.
- Pick a bike and battery you can service and repair, to spread the manufacturing footprint over many years of use.
- Arrange secure parking and a charging spot with a clean electricity supply if you can.
- Keep a plan for battery disposal through a proper collection or recycling route.
- Track whether your car use actually falls, because that is where the saving comes from.
Frequently asked questions
Are electric bikes really better for the environment than cars?
Yes, where they replace car journeys. A published commute comparison puts a car at 472 kg of CO2 a year against 13 kg for an e-bike, on a 9.6 km city commute and 252 working days.
How much CO2 does an e-bike emit per kilometre?
The most direct published comparison here is annual rather than per kilometre: 13 kg a year for the e-bike commute above, attributed to battery production. Per-distance rates depend on the assumed bike lifetime and electricity supply.
Can an electric bike replace a car for commuting?
It can for many regular journeys. England research finds the highest per-person saving capability, over 750 kg CO2 a year, among rural and rural-fringe residents, and a more modest one in major conurbations.
What happens to e-bike batteries at end of life?
A spent lithium-ion pack should go to a battery collection or recycling route via the manufacturer, retailer or a local scheme. Outcomes vary by place, so check local arrangements before disposing of one.